Choosing a supplier used to be a gut-feel exercise for a lot of companies. You had the spreadsheet with the pricing, maybe a few notes from the last time a batch came in wrong, and the institutional memory of whoever had been placing orders the longest. Odoo 20 just made that considerably harder to justify. The Quality app now calculates a vendor quality rate — a single percentage that tells you how often a given supplier’s deliveries pass your quality checks — and it shows up in the three places where procurement teams actually make decisions.
One Number, Three Places to Find It
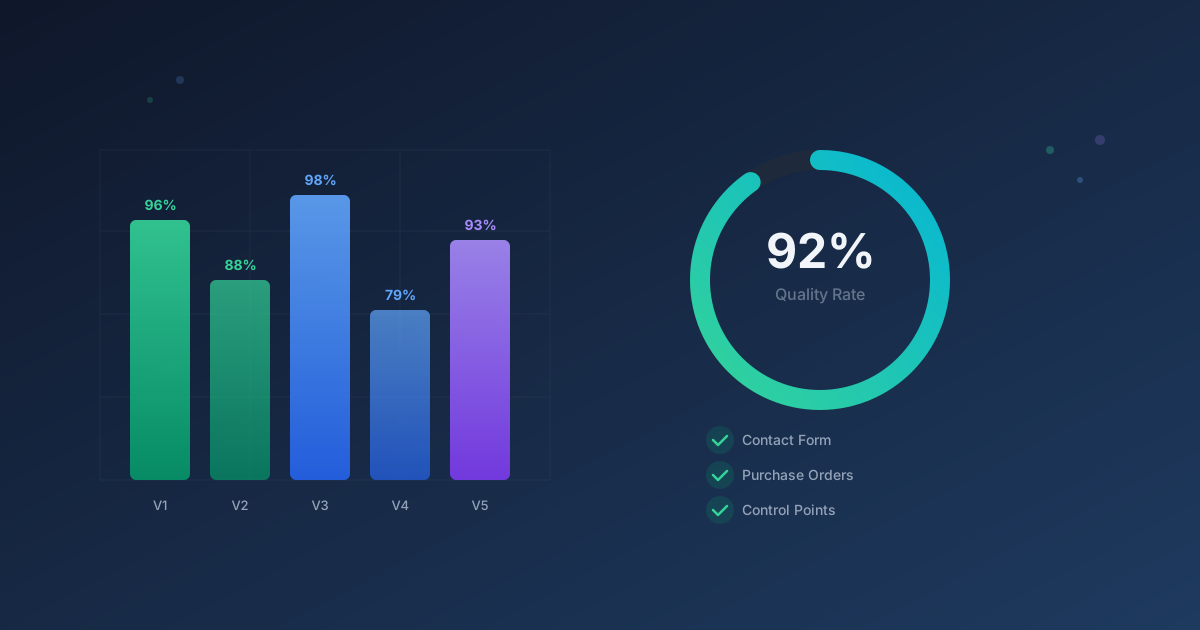
The quality rate isn’t buried in a report you have to go looking for. It appears directly on a vendor’s contact form, giving anyone in the organization an immediate read on that supplier’s track record. Open a contact, see the percentage. No navigation required.
More importantly, it also shows up on requests for quotation and purchase orders. That’s the moment that matters: when you’re deciding whether to place an order with Supplier A or Supplier B, the quality rate is right there alongside the price and delivery terms. It turns a purchasing decision into a more complete equation — cost versus reliability, spelled out in a number you didn’t have to calculate yourself.
The third surface is the quality control point itself. When a quality team member is inspecting incoming goods, they can see the supplier’s historical pass rate in context. That baseline helps calibrate expectations and can flag when a previously reliable vendor starts slipping before the pattern becomes obvious to anyone else.
How the Score Gets Calculated
The quality rate is straightforward: it’s the percentage of quality checks that a vendor’s deliveries have passed over time. Every time a receipt triggers a quality check — whether that’s a visual inspection, a measurement, or a pass/fail gate — the result feeds into the vendor’s running score. Pass the check, the rate stays high. Fail it, and the number drops.
This is the kind of metric that gets more valuable the longer you use it. A vendor with a 98% quality rate across 500 checks tells you something very different than one with 98% across five checks. The system accumulates history automatically, which means the scores become more meaningful as your quality process matures — without anyone having to maintain a side spreadsheet or run periodic analyses.
What This Changes for Procurement Teams
The immediate impact is on vendor negotiations and sourcing decisions. When you can point to a concrete quality rate, conversations with underperforming suppliers become less subjective. Instead of “we’ve had some issues lately,” you can say “your pass rate dropped from 94% to 81% over the last quarter.” That’s a different conversation entirely.
It also creates a natural incentive structure. Vendors who know their quality rate is visible — and that it influences whether they get the next order — have a concrete reason to maintain consistency. The metric becomes a shared language between buyer and supplier, one that both sides can reference without ambiguity.
For companies managing complex supply chains with dozens or hundreds of vendors, the quality rate also serves as an early warning system. A gradual decline in a vendor’s score might not trigger any single alarm, but the trend line is visible to anyone who pulls up the contact form. Catching a quality slide early — before it turns into a production stoppage or a customer complaint — is exactly the kind of problem that a persistent, automatically calculated metric is designed to solve.
A Quiet but Consequential Addition
Vendor quality tracking isn’t a flashy feature. It won’t make a demo reel or a keynote stage. But for manufacturing companies, distributors, and anyone whose business depends on the reliability of incoming materials, it addresses a gap that has existed in most ERP systems for years: the disconnect between quality data and purchasing decisions.
By embedding the quality rate into the purchasing workflow rather than isolating it in a quality module, Odoo 20 makes it nearly impossible to place an order without at least glancing at the supplier’s track record. That subtle shift — from “quality data exists somewhere” to “quality data is right here, right now” — is the kind of design decision that quietly changes how organizations operate.