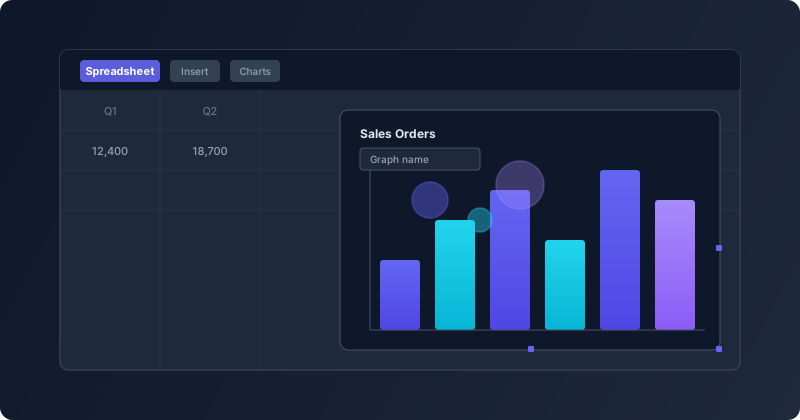
Small interface changes rarely make headlines, but they accumulate into the kind of friction that makes or breaks a daily workflow. The spreadsheet module in Odoo 20 has received a set of targeted refinements to how charts are created, named, and managed — changes that individually seem minor but together represent a noticeable smoothing of the charting experience.
The “Insert in Spreadsheet” Button Is Now Just “Spreadsheet”
Anyone who has used Odoo’s graph views knows the routine: build a pivot or graph view, then click a button to send it into a spreadsheet for further work. That button previously read “Insert in Spreadsheet” — five words for what is essentially a one-step action. In Odoo 20, it’s been trimmed to just “Spreadsheet.”
It sounds trivial, but toolbar real estate matters. When you’re looking at a dense interface with multiple action buttons, the shorter label is faster to scan. The action hasn’t changed — you still get the same insertion dialog — but the cognitive load of finding the right button drops slightly.
Clearer Labels Inside the Chart Dialog
The insertion dialog itself picked up several label changes. The field that was previously called “Name of the graph” is now “Graph name” — shorter, consistent with how Odoo labels fields elsewhere in the system. The confirmation button at the bottom of the dialog changed from “Confirm” to “Insert,” which is more descriptive of what actually happens when you click it.
These are the kinds of changes that a new user benefits from immediately. “Confirm” could mean anything in a modal dialog. “Insert” tells you exactly what the system will do.
The Documents App Drops the “Odoo” Prefix
When saving a chart to a new spreadsheet, the note that previously referenced “Odoo Documents” now just says “Documents.” The My Drive icon has also been updated from the old hard-drive icon to a storage icon that matches the current icon set. This is part of a broader pattern across Odoo 20 where the product name is being removed from internal references to its own modules. When you’re already inside Odoo, being told to go to “Odoo Documents” is redundant — of course it’s Odoo’s Documents app.
Chart Documentation Split Into Dedicated Sections
Beyond the interface changes, the underlying documentation for spreadsheet charts has been restructured. What was previously a single page covering chart creation, customization, and management has been broken out into separate sections. Chart property editing now lives under its own “Customize” reference, and chart administration gets a dedicated “Manage” section.
For users who already know how to create a chart and just need to look up a specific customization option — changing axis labels, adjusting colors, toggling data series — this means fewer irrelevant paragraphs to scroll past. The documentation mirrors how people actually use charts: you create them once, but you tweak and manage them repeatedly.
Bubble Charts and Resizable Chart Frames
The documentation now includes coverage of bubble charts as a supported chart type, with updated visual references showing how the bubble format renders within a spreadsheet cell range. Bubble charts are particularly useful for three-dimensional data comparisons — plotting two variables on the axes while using bubble size to represent a third, like revenue by region with deal count determining the bubble diameter.
The chart resize workflow also received updated documentation with clearer visuals showing the drag handles that appear when a chart is selected. This addresses a common support question: users who didn’t realize charts could be resized in place were recreating them at different sizes instead.
Why the Small Things Add Up
None of these changes individually would justify a version bump. But taken together, they represent the kind of systematic polish that distinguishes a mature product from one that’s merely feature-complete. The spreadsheet module in Odoo has grown from a basic grid into a serious analytical tool, and the charting workflow is one of its most visible capabilities. Making that workflow feel tighter — fewer words to read, more descriptive buttons, better-organized reference material — is how you keep power users productive without overwhelming new ones.