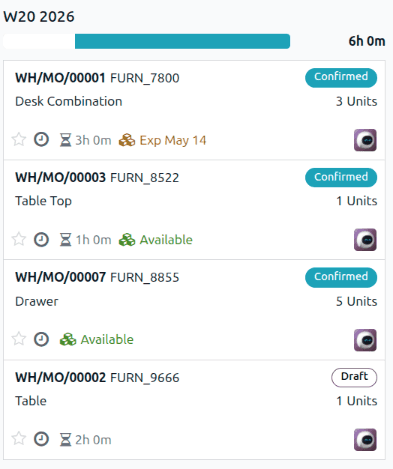
Production managers live on two screens: the one showing what’s happening right now on the floor, and the one showing what’s supposed to happen next. For years, getting that second view in Odoo’s Manufacturing app meant toggling between list views, applying filters manually, and mentally assembling the picture from rows of data.
That changes with a new production overview built directly into the Manufacturing Orders Kanban view. It’s not a separate module or a bolt-on reporting tool. The existing Kanban board has been re-engineered to function as a live production dashboard, and the density of information packed into each card makes it genuinely useful for floor-level decision making.
Each Card Tells the Whole Story
Every manufacturing order appears as a card displaying the order number, product name, quantity, current status, priority level, remaining work order time, component availability, and the responsible user. If a work order is actively running, the card surfaces the current work center. If the order has child manufacturing orders created from subassemblies in the bill of materials, their statuses display directly on the parent card.
That last detail is significant. In complex manufacturing environments where a single finished product depends on subassemblies that are themselves being manufactured, seeing the sub-order status without drilling into each record eliminates one of the most common sources of production surprises: a finished goods order shows “ready” but one of its component assemblies is stuck three stages back.
Status Bars That Actually Communicate
Above each column of cards sits a progress bar showing the percentage breakdown of every status type for all orders in that grouping. Each status — draft, confirmed, in progress, done — gets an assigned color that fills the bar proportionally. At a glance, a production manager can see that Monday’s orders are 60% complete with 15% still in draft, or that the “Circuit Boards” product group has three blocked orders against twelve in progress.
The time estimate next to each grouping header adds another layer. It aggregates the expected remaining production time for all orders in the column, giving managers a rough answer to “how many hours of work are left in this batch?” without summing anything manually.
Grouping Options That Match How Factories Think
By default, the overview groups orders by weekly production — showing this week’s orders, next week’s, and so on. But the grouping options go well beyond date-based views.
Grouping by Product clusters all orders for the same item together, making it easy to see total production volume per SKU. Grouping by Status sorts everything into confirmed, draft, and in-progress buckets for a pipeline-style view. Grouping by Material Availabilitysplits orders into “Ready” and “Waiting” columns — arguably the most operationally useful view, since it immediately answers the question every production manager asks first: “what can we actually start right now?”
Date-based grouping offers granularity from yearly down to daily, and a separate deadline grouping option lets managers sort by customer-facing due dates rather than internal scheduling dates. The distinction matters in make-to-order environments where the production schedule and the customer deadline don’t always align.
Four Views for Four Different Questions
The production overview Kanban isn’t the only way to look at the data. The Manufacturing Orders page now explicitly supports four views: the traditional list for search and bulk editing, Kanban for the visual overview, Gantt for timeline-based forecasting with manufacturing orders displayed as bars under a time scale, and a calendar view for date-oriented navigation.
Each view answers a different operational question. The list says “show me everything and let me filter.” The Kanban says “what’s the health of my production right now?” The Gantt chart says “do I have scheduling conflicts next week?” And the calendar says “what lands on which day?” Having all four accessible from the same page, with shared filters, means the context carries over when switching between them.
Built for the Person Standing on the Floor
The production overview doesn’t require any configuration. It opens with a sensible default — orders in “To Do” status, grouped by week, sorted by priority then scheduled date. A production manager walking up to a screen at 7 AM sees exactly what needs attention without setting up a single filter.
For manufacturing environments that have been building custom dashboards or exporting data to spreadsheets just to get a visual read on production status, this is the kind of built-in feature that eliminates an entire category of workaround. It doesn’t do anything revolutionary. It just puts the information where it should have been all along.